Two Good Tools for Peeking Inside Windows
Over the last couple of weeks I have explored the inner mechanics of Microsoft Windows, and the processes that run in this context. In this process two tools have proved especially useful: Xperf logs with WPA and Sysinternal’s Process monitor.
Xperf/WPA
During execution Windows is continuously surveying it’s internal processes through the Event Tracing for Windows (ETW). We may harness this internal surveying by extracting the data through the program Xperf. From specific points in the execution (which we decide when we initially start the logging) we can sample what is happening within the program and in the system as a whole.Two good features I have utilized from Xperf/WPA combo are:
- Process Images We can which ‘.dll’-images are loaded by each process, and when they are loaded.
- We can view, over time, what system resources such as memory. CPU, and IO are used by each process or by the system as a whole.
Both these tools are included in the Windows Performance Toolkit which again is part of the Windows Assessment and Deployment Kit. You can during the assessment and deployment kit installation choose to install only the performance toolkit.
To record a session you need to call Xperf twice from the command shell: first to start the logging with specific flags to point out from which internal flags a sample should be made, then secondly to stop the logging and print the results to an .etl file.
A typical start command could be:
xperf -on latency -stackwalk profile
In this example xperf is called with the latency group in kernel mode which is looking at the following flags: PROC_THREAD+LOADER+DISK_IO+HARD_FAULTS+DPC+INTERRUPT+CSWITCH+PROFILE. The stackwalk options provides a stack for the flags or group provided. For a complete list of kernel flags you can use the “xperf -providers k” command.
Once you have started Xperf and performed the action you wanted to record, you may stop xperf with this command
xperf -d output.etl
The -d option is explicitly telling xperf to append the logged session to the file output.etl (or create this file if not existing). The command also implicitly tells the logging session to stop.
For full overview over the commands accepted by Xperf, please refer to the Xperf options documentation at MSDN.
To analyze an .etl file, and the data that has been collected in the logging session, Microsoft has made available a good tool: Windows Performance Analyzer.

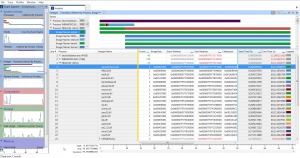
This neat tool provides small views for viewing the genral KPI for the resources to the left, and all of the main resources has expandable menus for more detailed views. Double clicking, or right clicking and selecting to open the section in the main window opens a more detailed overview in the right view of the application. Here the user can go into detailed depth of the applications. In the screenshot you can see the images loaded by the relatively simple command line application Ping.
Process Monitor
The Sysinternal toolkit contains many useful tools for various Windows-related tasks among others the ability to see the activities of a process over time. The latter is straight in the domain of the Process Monitor. With this convenient tool you can get an overview over what operations including registry queries, use of file resources and loading of images a process is doing.
With the Process Monitor you can surveying the system as a whole, and also filter for a specific process. The program traces many of the calls the program is making to the system, and you can use this trace to see in what sequence a program is executing and also which and what kind of system resources it relies on. The combination Xperf and WPA could give an good overview over the images loaded by a process, and with the Process Monitor you may expand this knowledge with Registry queries and Network calls, you can also look at when different profiling actions are called.
- Process Monitor from the Sys internal Suite is a good tool to scrutinize what is happening with one or more process.
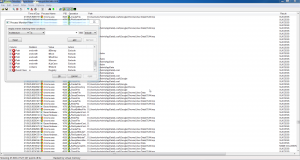
Process Monitor is used both for recording a trace, and for analyzing this afterwards. The traces can be saved to file. They can also be conveniently filtered through the filter functionality, either on the specific types of actions performed by a process (registry, file system, network resources, process and thread activity and profiling), using the symbols to the right of the menu. There is also a filter functionality, displayed in the image by the overlying window, here a good rule to make is to exclude all the actions not associated to the process which you want to survey.
Be advised that Process Monitor records a huge amount of actions. It can be a good idea to turn off recording when you not intend to record, and this can be achieved by toggling the magnifying glass in the menu.
An advantages of the programs in the Sysinternal toolkit, Xperf and WPA is that they do not need to be installed to work. All these tools can be put on a USB stick, and with some training you have suddenly become an one-man-army ready for examining the inside out of Windows.
The image used to illustrate this blog post is by Julian E…, it’s found through Flickr and shared under a Creative Commons by-nc-nd license.
